Auto Model Selection
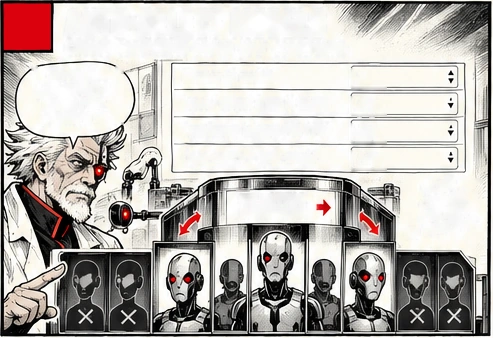
Based on your need Dr.Gero picks the best model by means of cost, speed and performance among more than 400 candidates
| Factor | Generalist (GPT5 API) | Open-Source | Dr.Gero |
|---|---|---|---|
| Latency | 550–900 ms | 300–500 ms (-50%) | 150–300 ms (-30%) |
| Cost / M tokens | $10–$15 | $1–$3 (-90%) | $0.3–$3 (-98%) |
| Accuracy | 50–70% | 48–66% (-4%) | 85–95% (+30%) |
| Domain expertise | Medium | Medium | High |
| Competitive advantage | Commodity | Differentiator | Proprietary and defensible |
| Compliant | Low | High | High |
Based on your need Dr.Gero picks the best model by means of cost, speed and performance among more than 400 candidates
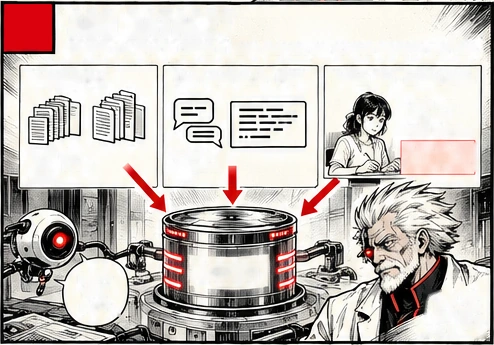
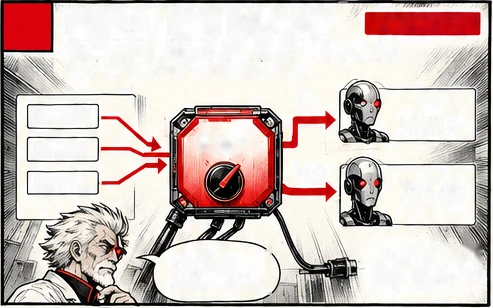
Dr.Gero automatically decides best base model to fine-tune, best hyper-parameters and creates your own unique, IP protected AI model
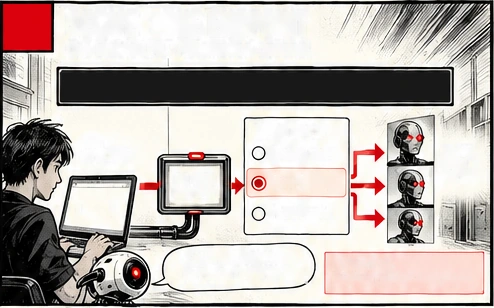
Dr.Gero delivers the best performance over time: it keeps learning and fine tuning based on new data or when a new base model is launched
From your task to production
Same
questions.
A smarter
way.
Let’s
build
it.
Real tasks.
Better models.
Less waste.
AI
that
works.
For you.
Define the task. Choose how to judge answers.
Task prompt
What is a good response
to this customer question?
Choose one evaluator:
LLM as judge
Score quality against
the expected answer
and evaluation prompt.
Exact match
Compare deterministic
outputs.
Human evaluation
Enter cases, compare
model answers and mark
every correct response.
Same
task.
Different
perspectives.
Better
decisions.
Connect agent traces, use a dataset, or start with manual cases.
Hugging Face
Live agent traces · PUSH
Human Eval · manual cases
Load a JSON,
JSONL, or CSV
dataset.
Application
input/output
events.
Create cases
and review
model responses.
Review after
choosing models.
Dataset
Bring
your
data.
Your task.
Your data.
Real results.
Set your cost, latency and model preferences.
Set your
constraints.
We’ll find
candidates.
Number of models
Input / output $ per M tokens
Latency P95 / P99
Open-source / open-weight only
5
$5 / $25
15s / 30s
No
Selecting
candidates
Filter.
Compare.
Evaluate
on your task.
Compare quality, latency and cost on your task.
Example run
| Model | Score | Latency | Cost / 1K |
|---|---|---|---|
| GPT-5.6 Sol | 66% | 2.6s | $1.19 |
| Gemini 3.6 Flash | 52% | 3.1s | $1.49 |
| GLM 5.1 | 48% | 12.2s | $1.33 |
| Claude Opus 5 | 46% | 5.8s | $5.93 |
| MiniMax M3 | 42% | 5.9s | $0.31 |
Run snapshot
Dataset +
model versions +
evaluator
Immutable record
of this run.
Same test.
Real comparison.
Keep a history.
Of what works.
Gero-0 / Automatic evaluation
Use a lower-cost model for part of your traffic.
Each request goes to
one model. Not both.
Higher task score
66%task score$1.19per 1,000 examples
Lower cost
42%task score$0.31per 1,000 examples
| Same task | GPT alone100% GPT-5.6 Sol | Gero-0 mix50% GPT + 50% MiniMax |
|---|---|---|
| Costper 1,000 examples | $1.19 | $0.75 |
| Task score | 66% | 54% |
37% lower costvs. using GPT alone
12-point lower score66% → 54% on this task
One stable URL. Automation optional.
POST /v1/leaderboard/{id}/inference
Your
application
{ ... }
Dr Gero
endpoint
Routing choice:
Ranking winner
Gero-0 mix
Pinned model
Selected
model
responds
Same interface.
Different strategies.
Human Eval:
Reviewed common-case winner.
Trigger new runs when your data or models change.
Optional · Automatic eval
Cron schedule
• Daily
• Weekly
• Monthly
• Custom
cron
New accepted
PUSH rows ≥ N
N new rows
New linked
Dr. Gero version
When a linked
model version
is available.
v2
Re-evaluate → new ranking
Keep improving
with new evidence.
On your terms.
Control
the triggers.
Measure
the changes.
Train on your data. Evaluate every new version.
Training data
Fine-tune
New version
Evaluate
Curated examples
for fine-tuning.
A new model
version.
Test on your task
before using
in production.
v2
Schedule fine-tuning.
Same endpoint.
New evidence.
Better
questions.
Brighter
outcomes.
From your task to production.
Define the task. Choose how to judge answers.
Connect agent traces, use a dataset, or start with manual cases.
Set your cost, latency and model preferences. Example configuration:
These example filters shortlist candidates. Evaluate them on your own task to measure actual quality, latency and cost.
Compare quality, latency and cost on your task. Here is a rounded example from one evaluation run.
| Model | Score | Latency | Cost / 1K |
|---|---|---|---|
| GPT-5.6 Sol | 66% | 2.6s | $1.19 |
| Gemini 3.6 Flash | 52% | 3.1s | $1.49 |
| GLM 5.1 | 48% | 12.2s | $1.33 |
| Claude Opus 5 | 46% | 5.8s | $5.93 |
| MiniMax M3 | 42% | 5.9s | $0.31 |
Each run snapshot records the dataset, model versions and evaluator. Keep an immutable record of that run.
Example run, not a general model benchmark. Costs are USD per 1,000 evaluation examples, calculated from average cost per example. Scores, latency and costs are rounded; your task and request sizes will change the results.
Split traffic between a higher-scoring model and a lower-cost model. Each request goes to just one model, not both.
In this example, Gero-0 routes approximately half of requests to GPT-5.6 Sol and half to MiniMax M3 over time.
| Model | Score | Latency | Cost / 1K |
|---|---|---|---|
| GPT-5.6 Sol | 66% | 2.6s | $1.19 |
| Gero-0 (50/50 mix) | 54% | 4.3s | $0.75 |
| MiniMax M3 | 42% | 5.9s | $0.31 |
The trade-off: about 37% lower average cost than GPT-5.6 Sol alone, with a 54% score instead of 66% in this example. The mix gives a higher score than using MiniMax M3 alone, at a higher cost.
Gero-0 is a routing mix, not a new model or a combination of two answers. Weights depend on the evaluation results; 50/50 is this example, not a fixed setting. Available in automatic evaluation. Without an eligible pair, use the ranking winner.
One stable URL. Automation optional.
POST /v1/leaderboard/{id}/inference
Your application calls the Dr. Gero endpoint. Your routing choice determines which selected model responds: the ranking winner, the Gero-0 model mix, or a pinned model.
Human Eval: reviewed common-case winner.
Optional, in automatic evaluation. Trigger new runs when your data or models change.
Re-evaluate to create a new ranking. Control the triggers; measure the changes.
Train on your data. Evaluate every new version.
Schedule fine-tuning on suitable training examples. Evaluate each new model version on your task before using it in production.
Same endpoint. New evidence.
Real agents. Real rankings.
Real examples from our users’ agents.
Even SOTA models can score poorly on specific tasks.
Real user-agent run
| Model | Score | Latency | $ / 1Kexamples | Score / $vs. #1 |
|---|---|---|---|---|
| #1GPT-5.6 Sol | 66% | 2.63 s | $1.19 | 1.00× |
| #2Gero-050/50 MIX | 54% | 4.26 s | $0.75 | 1.30× |
| #3Gemini 3.6 Flash | 52% | 3.14 s | $1.49 | 0.63× |
| #4GLM 5.1 | 48% | 12.22 s | $1.33 | 0.65× |
| #5Qwen3.8 2.4T A95B | 48% | 6.53 s | $2.08 | 0.42× |
| #6Claude Opus 5 | 46% | 5.80 s | $5.93 | 0.14× |
| #7MiniMax M3 | 42% | 5.89 s | $0.31 | 2.45× |
| #8DeepSeek V4 Flash 0731 | 40% | 14.25 s | $1.01 | 0.72× |
| #9MiMo-V2.5 | 32% | 13.97 s | $1.09 | 0.53× |
| #10Hy-MT2-30B-A3B | 20% | 859 ms | $0.08 | 4.38× |
| #11Nemotron 3.5 Lightning | 8% | 15.89 s | $0.00 | Free |
| #12Vinclat-qwen | 6% | 1.60 s | $1.17 | 0.09× |
Real user-agent run
| Model | Score | Latency | $ / 1Kexamples | Score / $vs. #1 |
|---|---|---|---|---|
| #1gpt-oss-120b | 100% | 1.41 s | $0.59 | 1.00× |
| #2Claude Opus 5 (Fast) | 100% | 2.80 s | $249.82 | <0.01× |
| #3MiMo-V2.5 | 95% | 5.33 s | $1.32 | 0.42× |
| #4Gero-050/50 MIX | 95% | 6.84 s | $0.29 | 1.90× |
| #5Laguna S 2.1 | 90% | 12.26 s | $0.00 | Free |
| #6DeepSeek V4 Flash 0731 | 90% | 5.35 s | $1.34 | 0.40× |
| #7Step 3.7 Flash | 90% | 3.87 s | $4.26 | 0.12× |
| #8Gemini 3.6 Flash | 90% | 1.63 s | $11.10 | 0.05× |
| #9MiniMax M3 | 80% | 3.44 s | $4.23 | 0.11× |
| #10qwen/qwen3.6-flash | 70% | 1.77 s | $3.07 | 0.13× |
| #11MMMD | 0% | — | — | — |
Across the two real runs
Task-specific results matter more than a model’s reputation.
| Model | Run 01 | Run 02 | Difference |
|---|---|---|---|
| MiMo-V2.5 | 32% | 95% | +63 pp |
| DeepSeek V4 Flash 0731 | 40% | 90% | +50 pp |
| MiniMax M3 | 42% | 80% | +38 pp |
| Gemini 3.6 Flash | 52% | 90% | +38 pp |
Different evaluation snapshots; not a claim of model improvement.
pp = percentage points.
Calculated from the same runs
Gero-0 trades some task score for lower inference cost.
| Run / score | #1 model | Gero-0 | Saved |
|---|---|---|---|
| Run 0166% → 54% score | $11.88 | $7.48 | $4.40 |
| Run 02100% → 95% score | $5.89 | $2.94 | $2.94 |
#1: GPT-5.6 Sol in run 01; gpt-oss-120b in run 02.
Volume × recorded average cost. Platform fees excluded.
Start in the lab. Scale into production.
Explore the lab
$0
plan fee
Try model comparisons with limited usage and model access.
For production
5.5%
fee on provider inference
Add balance and pay for usage. Provider charges are separate.
Built around your team
Custom
terms and pricing
Discuss deployment, support and commercial requirements.
Contact us to learn how we can reduce your inference costs by up to 98%.